

Tracking and sharing impact
Explore AICCRA’s ‘Deliverables by the Numbers’
AICCRA is a project that aims to improve access to climate-smart technology, advisory services, and information so that African small-scale farmers and stakeholders can effectively address climate-related issues and benefit their communities and the environment.
Effective data management is crucial for achieving these goals, as it ensures project information is accurate, accessible and available for decision-makers.
In response, AICCRA’s Knowledge and Data-Sharing team have developed a new interactive tool to demonstrate our commitment to good evidence dissemination practices, and to showcase key statistics from our data management efforts.
While not specifically designed as an information explorer, the dashboard allows users to access and explore information on our knowledge products.
We welcome feedback about how to further develop and improve the dashboard.
Why data management matters
As a complex, multi-country funded project with delineated outcomes, effective data management is crucial for tracking, managing, and reporting on AICCRA’s project goals. It also ensures that project information is accurate, accessible, and available for relevant decision-makers.
By implementing a comprehensive data management plan, we are able to demonstrate our commitment to addressing climate-related challenges and ensuring that the performance indicators of AICCRA’s work are transparent and accountable.
To further strengthen our culture of results-based project management, we’ve developed a new interactive dashboard that not only presents key statistics showcasing the outcomes of having a standardized process for good dissemination practices, but also allows users to explore and filter information on specific and tangible knowledge products generated within AICCRA.
The dedication and engagement of our AICCRA’s Cluster Leaders in disseminating knowledge and results, that support our Key Performance Indicators, has been essential in driving the proposed data management plan. We recognize and appreciate their commitment to this important effort. Hector Tobon, Knowledge and Data Sharing Coordinator, AICCRA
About the dashboard
By providing a comprehensive overview of AICCRA's work, the interactive ‘By the Numbers’ dashboard allows users to easily explore and learn about the scope and impact of the project.
The digital tool, created in Microsoft Power BI, uses information collected from the Monitoring System used by AICCRA called MARLO (Managing Agricultural Research for Learning and Outcomes). Users can navigate through different sections listed in the left menu to explore information on deliverables, cluster contributions and trends in AICCRA’s outcomes.
Using the dashboard
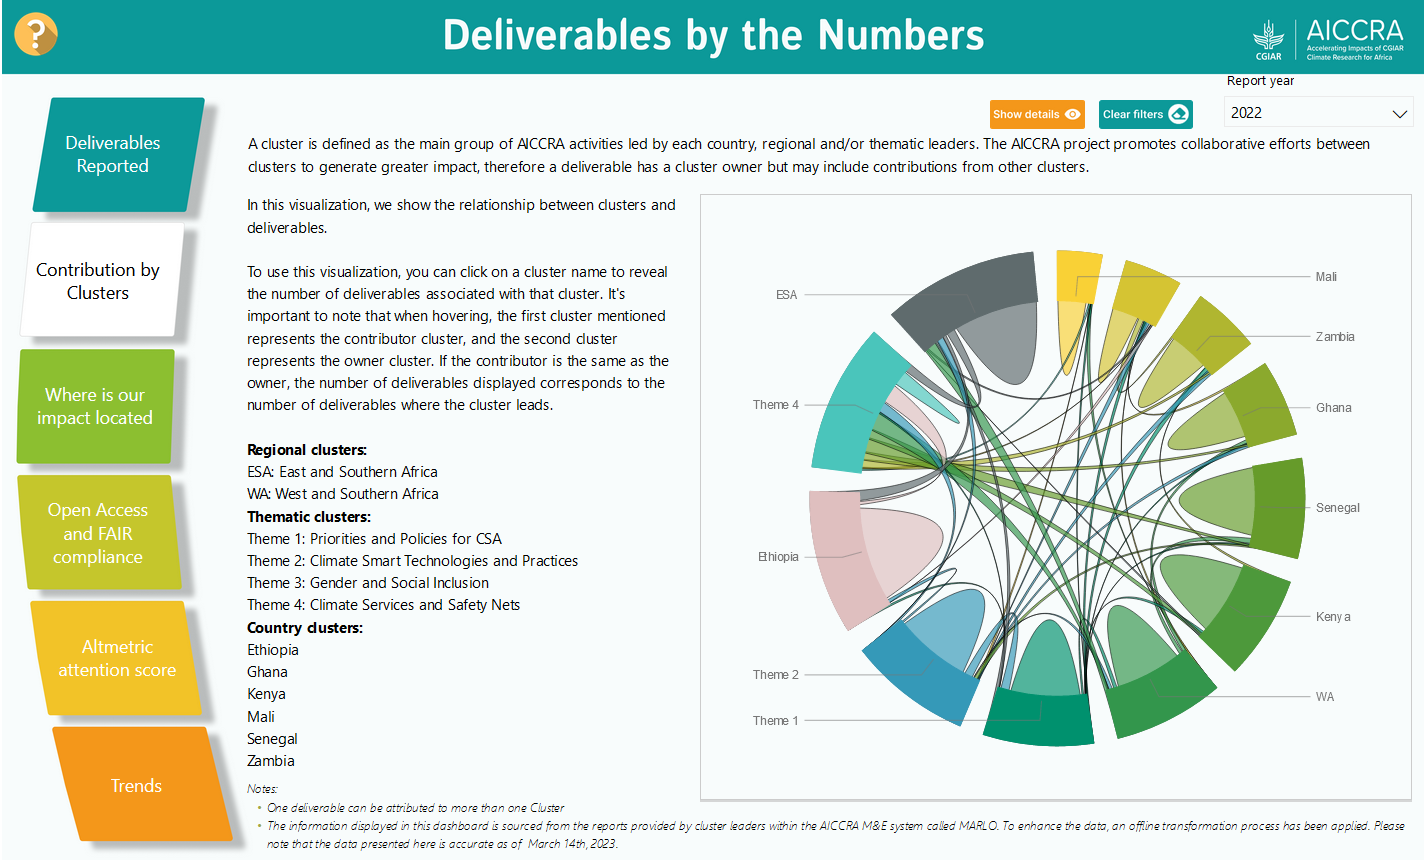
In the ‘Deliverables by the Numbers’ dashboard, users can apply multiple filters (e.g., Report Year) to each menu option to access more specific information on the data. Where relevant, users can also find links to the knowledge products or deliverable.

Users are able to click on the visualizations and add filters by holding down the control (Ctrl) key and clicking. For example, you can view the deliverables for a specific scope under the "Where is our impact located" tab by clicking on a bubble on the map. Or in the "Open Access and FAIR compliance" screen, users can filter deliverables by their open access and interoperable characteristics. Simply click on a deliverable category and Interoperable principle to view the relevant deliverables.
Explore AICCRA’s deliverables and knowledge products
Aligning with CGIAR’s Open Access policy
Developing this publicly available dashboard aligns with AICCRA’s commitment to the CGIAR Open Access policy and the FAIR principles (to do with the Findability, Accessibility, Interoperability, and Reuse of digital assets).
These transparency and accessibility policies are supported by a rigorous process of deliverables management that functions much like a conveyor belt.
1. The process starts with planning. We map the expected deliverables – such as workshops, published papers or blog articles - to our project performance indicators and the institutions and groups responsible for them.
2. Once the deliverables are complete, they are disseminated through channels (e.g. CGSpace, Dataverse, etc.) and given a permanent identifier like a handle or a DOI.
3. The permanent identifier is then input into our M&E System (MARLO) to provide evidence of the completed deliverable which then extracts additional information focused on the context of the project, such as our clusters and our performance indicators.
4. This process allows us to map the deliverable or product to the CGIAR Open Access policy and FAIR Principles, ensuring that our work is aligned with these standards.
Feedback
We invite users to explore the ‘Deliverables by the Numbers’ dashboard and contact us (MARLOSupport@cgiar.org) with any comments or suggestions you may have to improve its useability and value.
Contributors
Claudia Castiblanco, Knowledge and Data Sharing BI Analyst, AICCRA
Margarita Ramirez, Knowledge and Data Sharing Information Officer, AICCRA
Hector Tobon, Knowledge and Data Sharing Coordinator, AICCRA
Cristian Pizo, Knowledge and Data Sharing Front-end Developer, AICCRA
Kenji Tanaka, Knowledge and Data Sharing Senior Back-end Developer, AICCRA
Amy Harris, Global Communications - Social Media and Digital Content Manager, AICCRA
Rhys Bucknall-Williams, Global Communications & Knowledge Manager, AICCRA
David Abreu, Technology Integration Director, Alliance Bioversity-CIAT